Plot a Reaction between Stoichiometric Phases
from thermoengine import phases
from thermoengine import model
import numpy as np
import matplotlib.pyplot as plt
%matplotlib inline
Get access to a thermodynamic database (by default, the Berman (1988) database).
modelDB = model.Database()
To print a list of all of the phases in the database, execute:
print(thermoDB.all_purephases_df.to_string())
Specify a new reaction by indicating reactants, products.
forsterite + quartz = 2 enstatite
reaction = modelDB.get_rxn(['Fo','Qz','cEn'],[0,0,0],[-1,-1,2])
<string>:6: DeprecationWarning: Calling nonzero on 0d arrays is deprecated, as it behaves surprisingly. Use atleast_1d(cond).nonzero() if the old behavior was intended. If the context of this warning is of the form arr[nonzero(cond)], just use arr[cond].
Set up temperature bounds, and calculate the univariant curve.
Tlims = 273.15+np.array([500,2000])
univariant_line = reaction.trace_boundary(Tlims=Tlims,Nsamp=100)
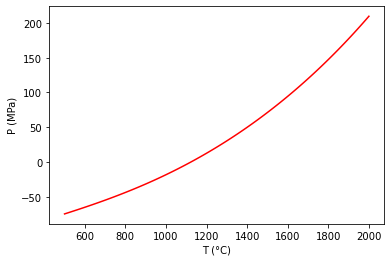
Now, plot up the results.
plt.plot (univariant_line[0]-273.15, univariant_line[1]/100.0, 'r-')
plt.ylabel('P (MPa)')
plt.xlabel('T (°C)')
plt.show()