PhaseObjC - Plot a Reaction between Stoichiometric Phases
from thermoengine import phases
from thermoengine import model
import numpy as np
import matplotlib.pyplot as plt
%matplotlib inline
Get access to a thermodynamic database (by default, the Berman (1988) database).
modelDBStix = model.Database('Stixrude')
To print a list of all of the phases in the database, execute:
print(thermoDB.all_purephases_df.to_string())
Specify a new reaction by indicating reactants, products.
forsterite = Mg-Wads
reaction = modelDBStix.get_rxn(['Fo', 'MgWds'], [0, 0], [-1, 1])
fo = modelDBStix.get_phase('Fo')
wd = modelDBStix.get_phase('MgWds')
<string>:6: DeprecationWarning: Calling nonzero on 0d arrays is deprecated, as it behaves surprisingly. Use atleast_1d(cond).nonzero() if the old behavior was intended. If the context of this warning is of the form arr[nonzero(cond)], just use arr[cond].
Check on the thermodynamic properties of the two phases close to a known equilibrium point:
p = 150000 # pressure in bars
t = 2100 # temperature in Kelvins
print(fo.gibbs_energy(t, p), wd.gibbs_energy(t, p))
print(fo.enthalpy(t, p), wd.enthalpy(t, p))
print(fo.entropy(t, p), wd.entropy(t, p))
print(fo.volume(t, p), wd.volume(t, p))
print(fo.heat_capacity(t, p), wd.heat_capacity(t, p))
-1926419.5746241454 -1926366.384172494
-1106691.3841051687 -1116548.7015712014
390.34675738998897 385.6274679053774
4.1087559308237935 3.9105580237791036
180.7443249827713 183.95270593836193
Set up temperature bounds, and calculate the univariant curve.
In this case convergence reqiuires specifying an initial guess for the equilibrium T (in K)
Tlims = 273.15+np.array([700,2500])
univariant_line = reaction.trace_boundary(Tlims=Tlims,Nsamp=100)
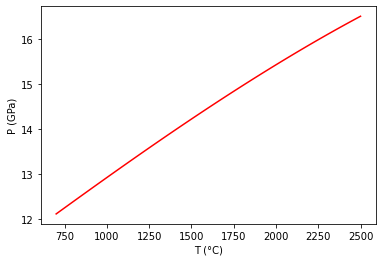
Now, plot up the results.
plt.plot (univariant_line[0]-273.15, univariant_line[1]/1e4, 'r-')
plt.ylabel('P (GPa)')
plt.xlabel('T (°C)')
plt.show()