Phase Diagram Construction
Using the Berman(1988) database of pure solid phases (standard state properties)
import pandas as pd
import numpy as np
import matplotlib.pyplot as plt
from thermoengine import phases
from thermoengine import model
%matplotlib inline
Create Thermodynamic Database
modelDB = model.Database()
Generate Reactions of Interest
rxn_coef = [-1, +1]
rxn_endmem = [0, 0]

# Create reactions
rxns = []
rxns.append(modelDB.get_rxn(['And','Ky'], rxn_endmem, rxn_coef))
rxns.append(modelDB.get_rxn(['And','Sil'], rxn_endmem, rxn_coef))
rxns.append(modelDB.get_rxn(['Ky','Sil'], rxn_endmem, rxn_coef))

# Create labels for legend
rxn_eqns = []
rxn_eqns.append('And = Ky')
rxn_eqns.append('And = Sil')
rxn_eqns.append('Ky = Sil')
<string>:6: DeprecationWarning: Calling nonzero on 0d arrays is deprecated, as it behaves surprisingly. Use atleast_1d(cond).nonzero() if the old behavior was intended. If the context of this warning is of the form arr[nonzero(cond)], just use arr[cond].
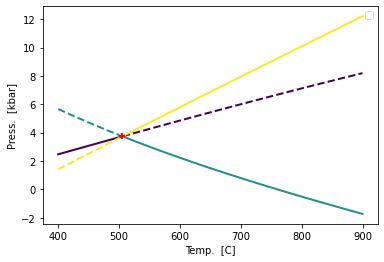
Calculate Triple Point
# Calculate triple point
T_tp, P_tp = rxns[0].simultaneous_rxn_cond(rxns[1])
print(T_tp,P_tp)
778.726955608905 3736.7184040516986
Plot Phase Diagram
def get_nice_colors(Ncolor):
    cmap = plt.get_cmap(name='viridis')
    ind_a = np.int_(np.round(np.linspace(0,255,Ncolor)))
    colors = [cmap.colors[ind] for ind in ind_a]
    return colors
colors = get_nice_colors(3)
Tlims = 273.15 + np.array([400,900])

rxn_bnds = []
T_bnds = []
P_bnds = []

plt.figure()

for irxn, col in zip(rxns, colors):
    iTbnds, iPbnds = irxn.trace_boundary(Tlims=Tlims, Nsamp=100)
    T_bnds.append(iTbnds)
    P_bnds.append(iPbnds)
    istable = irxn.stability(iTbnds, iPbnds, rxns)
    irxn_bnd, = plt.plot(iTbnds[istable]-273.15, iPbnds[istable]/1e3, '-',
                         lw=2, color=col)
    irxn_bnd_meta, = plt.plot(iTbnds[~istable]-273.15, iPbnds[~istable]/1e3, '--',
                         lw=2, color=col)

plt.plot(T_tp-273.15, P_tp/1e3,'r+',mew=2)

plt.xlabel('Temp.  [C]')
plt.ylabel('Press.  [kbar]')

plt.legend(rxn_bnds, rxn_eqns)
<matplotlib.legend.Legend at 0x7fe8e1222e90>