MELTS
Versions of MELTS implemented are:
- MELTS v. 1.0.2 ➞ (rhyolite-MELTS, Gualda et al., 2012)
- MELTS v. 1.1.0 ➞ (rhyolite-MELTS + new CO2, works at the ternary
minimum)
- MELTS v. 1.2.0 ➞ (rhyolite-MELTS + new H2O + new CO2)
- pMELTS v. 5.6.1
Initialize tools and packages that are required to execute this notebook.
from thermoengine import equilibrate
import matplotlib.pyplot as plt
import numpy as np
%matplotlib inline
Create a MELTS v 1.0.2 instance.
Rhyolite-MELTS version 1.0.2 is the default model.
melts = equilibrate.MELTSmodel()
Optional: Generate some information about the implemented model.
oxides = melts.get_oxide_names()
phases = melts.get_phase_names()
#print (oxides)
#print (phases)
Required: Input initial composition of the system (liquid), in wt% or grams of oxides.
Early Bishop Tuff average melt inlusion composition
feasible = melts.set_bulk_composition({'SiO2':  77.5,
                                       'TiO2':   0.08,
                                       'Al2O3': 12.5,
                                       'Fe2O3':  0.207,
                                       'Cr2O3':  0.0,
                                       'FeO':    0.473,
                                       'MnO':    0.0,
                                       'MgO':    0.03,
                                       'NiO':    0.0,
                                       'CoO':    0.0,
                                       'CaO':    0.43,
                                       'Na2O':   3.98,
                                       'K2O':    4.88,
                                       'P2O5':   0.0,
                                       'H2O':    5.5})
Optional: Suppress phases that are not required in the simulation.
b = melts.get_phase_inclusion_status()
melts.set_phase_inclusion_status({'Nepheline':False, 'OrthoOxide':False})
a = melts.get_phase_inclusion_status()
for phase in b.keys():
    if b[phase] != a[phase]:
        print ("{0:<15s} Before: {1:<5s} After: {2:<5s}".format(phase, repr(b[phase]), repr(a[phase])))
Nepheline       Before: True  After: False
OrthoOxide      Before: True  After: False
Compute the equilibrium state at some specified T (°C) and P (MPa).
Print status of the calculation.
output = melts.equilibrate_tp(760.0, 175.0, initialize=True)
(status, t, p, xmlout) = output[0]
print (status, t, p)
success, Minimal energy computed. 760.0 175.0
Summary output of equilibrium state …
melts.output_summary(xmlout)
T (°C)       760.00
P (MPa)      175.00
Quartz            1.2006 (g)  SiO2
Liquid          101.5218 (g)  wt %:SiO2 73.63 TiO2  0.08 Al2O3 11.87 Fe2O3  0.20 Cr2O3  0.00 FeO  0.47 MnO  0.00 MgO
                                  0.03 NiO  0.00 CoO  0.00 CaO  0.42 Na2O  3.79 K2O  4.61 P2O5  0.00 H2O  4.90
Sanidine          2.3292 (g)  K0.49Na0.50Ca0.01Al1.01Si2.99O8
Water             0.5285 (g)  H2O
Output thermodynamic properties of any phase present in the system
… or the sum of all phases in the system
props = melts.get_list_of_properties()
for prop in props:
    print ("{0:<20s} {1:13.6e} {2:<10s}".format(prop, melts.get_property_of_phase(xmlout,'System', prop), \
                                                melts.get_units_of_property(prop)))
Mass                  1.055800e+02 g
GibbsFreeEnergy      -1.723511e+06 J
Enthalpy             -1.444769e+06 J
Entropy               2.697990e+02 J/K
HeatCapacity          1.419994e+02 J/K
DcpDt                 1.086318e-02 J/K^2
Volume                4.885928e+00 J/bar
DvDt                  8.637431e-04 J/bar-K
DvDp                 -1.354787e-04 J/bar^2
D2vDt2                3.084601e-07 J/bar-K^2
D2vDtDp              -2.083152e-07 J/bar^2-K
D2vDp2                8.811872e-08 J/bar^3
Density               2.160900e+00 g/cm^3
Alpha                 1.767818e-04 1/K
Beta                  2.772834e-05 1/bar
K                     3.606418e+00 GPa
K'                    2.245704e+01 none
Gamma                 4.677198e-02 none
Output chemical affinities and potential compositions of undersaturated phases
dict = melts.get_dictionary_of_affinities(xmlout, sort=True)
for phase in dict:
    (affinity, formulae) = dict[phase]
    print ("{0:<20s} {1:10.2f} {2:<60s}".format(phase, affinity, formulae))
Leucite                 1843.53 K0.50Na0.50AlSi2O5.50(OH)1.00
Tridymite               2141.04 SiO2
Cristobalite            2204.71 SiO2
Spinel                  3443.41 Fe''1.00Mg0.00Fe'''0.00Al1.00Cr1.00Ti0.00O4
Magnetite               6100.91 Fe3O4
Coesite                 6702.07 SiO2
Ilmenite ss             7040.63 Mn0.00Fe''0.00Mg0.50Fe'''1.00Al0.00Ti0.50O3
Orthopyroxene           7481.78 Na0.00Ca0.50Fe''0.00Mg1.50Fe'''0.00Ti0.00Al0.00Si2.00O6
Pigeonite               7899.03 Na0.00Ca0.50Fe''0.00Mg1.50Fe'''0.00Ti0.00Al0.00Si2.00O6
Olivine                 8602.61 (Ca0.00Mg0.00Fe''0.50Mn0.50Co0.00Ni0.00)2SiO4
Fayalite               10535.94 Fe2SiO4
Ilmenite               10912.99 FeTiO3
Rutile                 13232.93 TiO2
Sillimanite            14224.20 Al2SiO5
Andalusite             14583.54 Al2SiO5
Corundum               14605.08 Al2O3
Kyanite                18244.50 Al2SiO5
Garnet                 18772.08 (Ca0.50Fe''0.50Mg0.00)3Al2Si3O12
Hematite               18830.66 Fe2O3
Biotite                19819.30 K(Fe''0.50Mg0.50)3AlSi3O10(OH)2
Nepheline              20015.65 NaAlSiO4
Sphene                 24104.31 CaTiSiO5
Muscovite              25188.37 KAl2Si3AlO10(OH)2
Phlogopite             28723.51 KMg3AlSi3O10(OH)2
Forsterite             29210.52 Mg2SiO4
OrthoOxide             29553.98 Fe''0.50Mg0.00Fe'''1.00Ti1.50O5
Kalsilite              33671.36 KAlSiO4
Cummingtonite          37212.14 Ca0.00Fe0.00Mg7.00Si8O22(OH)2
Perovskite             38528.62 CaTiO3
Anthophyllite          39317.80 Ca0.00Fe0.00Mg7.00Si8O22(OH)2
Periclase              43143.46 MgO
Nepheline ss           43681.21 Na2.00K2.00Ca0.00[]0.00Al4.00Si4.00O16
Melilite               48421.67 Na0.00Ca2.00Al2.00Mg-0.00Fe0.00Si1.00O7
Kalsilite ss           51793.54 Na2.00K2.00Ca0.00[]0.00Al4.00Si4.00O16
Hornblende             54565.30 NaCa2Mg2.00Fe2+2.00Al1.00Fe3+0.00Al2Si6O22(OH)2
Aenigmatite            58029.65 Na2Fe5TiSi6O20
Solid Alloy            69174.78 Fe1.00Ni0.00
Liquid Alloy           73771.78 Fe1.00Ni0.00
Akermanite             80666.47 Ca2MgSi2O7
Gehlenite              84296.04 Ca2Al2SiO7
Lime                  113534.98 CaO
Aegirine              141581.81 NaFeSi2O6
Actinolite            999999.00 Ca0.00Fe3.50Mg3.50Si8O22(OH)2
Whitlockite           999999.00 Ca3(PO4)2
Apatite               999999.00 Ca5(PO4)3OH
Chromite              999999.00 FeCr2O4
Plagioclase           999999.00 K0.00Na0.50Ca0.50Al1.50Si2.50O8
Augite                999999.00 Na0.00Ca0.50Fe''0.00Mg1.50Fe'''0.00Ti0.00Al0.00Si2.00O6
Titanaugite           999999.00 Na0.00Ca0.50Fe''0.00Mg1.50Fe'''0.00Ti0.00Al0.00Si2.00O6
Panunzite             999999.00 Na2.00K2.00Ca0.00[]0.00Al4.00Si4.00O16
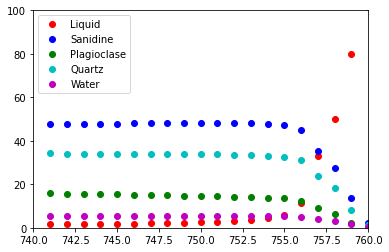
Run the sequence of calculations along a T, P=constant path:
Output is sent to an Excel file and plotted in the notebook
number_of_steps = 20
t_increment_of_steps = -1.0
p_increment_of_steps = 0.0

plotPhases = ['Liquid', 'Sanidine', 'Plagioclase', 'Quartz', 'Water']
# matplotlib colors b : blue, g : green, r : red, c : cyan, m : magenta, y : yellow, k : black, w : white.
plotColors = [ 'ro', 'bo', 'go', 'co', 'mo']

wb = melts.start_excel_workbook_with_sheet_name(sheetName="Summary")
melts.update_excel_workbook(wb, xmlout)

n = len(plotPhases)
xPlot = np.zeros(number_of_steps+1)
yPlot = np.zeros((n, number_of_steps+1))
xPlot[0] = t
for i in range (0, n):
    yPlot[i][0] = melts.get_property_of_phase(xmlout, plotPhases[i])

plt.ion()
fig = plt.figure()
ax = fig.add_subplot(111)
ax.set_xlim([min(t, t+t_increment_of_steps*number_of_steps), max(t, t+t_increment_of_steps*number_of_steps)])
ax.set_ylim([0., 100.])
graphs = []
for i in range (0, n):
    graphs.append(ax.plot(xPlot, yPlot[i], plotColors[i]))
handle = []
for (graph,) in graphs:
    handle.append(graph)
ax.legend(handle, plotPhases, loc='upper left')

for i in range (1, number_of_steps):
    output = melts.equilibrate_tp(t+t_increment_of_steps, p+p_increment_of_steps)
    (status, t, p, xmlout) = output[0]
    print ("{0:<30s} {1:8.2f} {2:8.2f}".format(status, t, p))
    xPlot[i] = t
    for j in range (0, n):
        yPlot[j][i] = melts.get_property_of_phase(xmlout, plotPhases[j])
    j = 0
    for (graph,) in graphs:
        graph.set_xdata(xPlot)
        graph.set_ydata(yPlot[j])
        j = j + 1
    fig.canvas.draw()
    melts.update_excel_workbook(wb, xmlout)

melts.write_excel_workbook(wb, "MELTSv102summary.xlsx")
success, Minimal energy computed.   759.00   175.00
success, Minimal energy computed.   758.00   175.00
success, Minimal energy computed.   757.00   175.00
success, Minimal energy computed.   756.00   175.00
success, Minimal energy computed.   755.00   175.00
success, Minimal energy computed.   754.00   175.00
success, Minimal energy computed.   753.00   175.00
success, Minimal energy computed.   752.00   175.00
success, Minimal energy computed.   751.00   175.00
success, Minimal energy computed.   750.00   175.00
success, Minimal energy computed.   749.00   175.00
success, Minimal energy computed.   748.00   175.00
success, Minimal energy computed.   747.00   175.00
success, Minimal energy computed.   746.00   175.00
success, Minimal energy computed.   745.00   175.00
success, Minimal energy computed.   744.00   175.00
success, Minimal energy computed.   743.00   175.00
success, Optimal residual norm.   742.00   175.00
success, Minimal energy computed.   741.00   175.00